Effective Management of Your Entire Building Portfolio Requires a Big Picture View

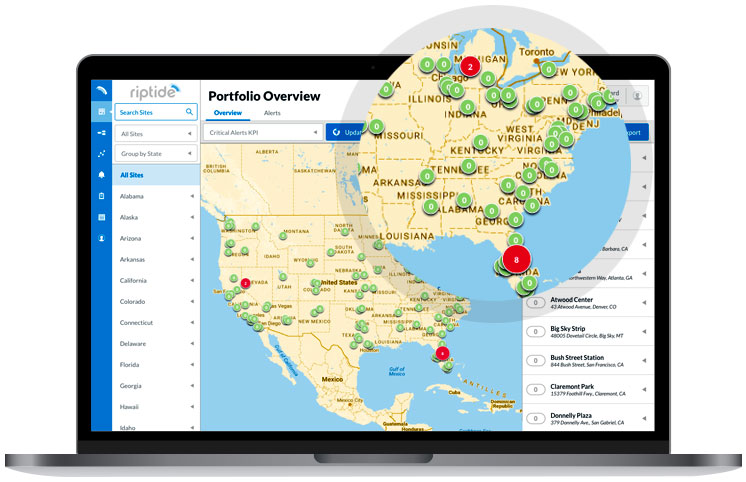
See how your whole portfolio is performing based on Key Performance Indicators (KPI’s) you’ve assigned. Query and get answers in one view. Prioritize quickly and take action.

The Building Automation and Controls Gap

Do you have a legacy building automation system? Are you considering a new add-on? Are you starting from scratch? In every case, Riptide cloud-based software fills a gap the industry has never been able to bridge.

Incidents vs. Trends

Typical control systems deluge you with data on isolated incidents, “anomalies” and alarms over short periods. To identify, prioritize and fix problems as they develop, you need to see portfolio-level trends for your own KPI’s.

Niches vs. All Variables

New add-ons attempt to fill the gap, but they only offer partial solutions, with colorful visualizations for niche areas like energy or meters. What you really need is an actionable view of all the variables you can measure.

One-by-One vs. Total Portfolio

Right now you only get data on one building at a time. If you have a big portfolio, it takes hundreds of hours to consolidate and pull the relevant analytics. Instead, get instant answers across your total portfolio.

Our KPI-based Building Portfolio Management System Operates on this Simple Principle

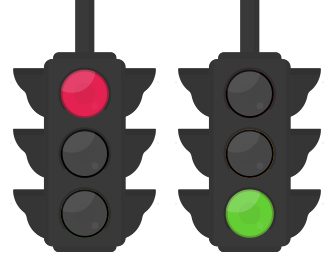
Red light, green light. Our signal system makes it simple to see which mechanical systems across your entire portfolio map are performing according to KPI’s (Key Performance Indicators) you’ve set (green dots), and which aren’t (red dots). Query any KPI, standard or criterion you define, for any period of time. See what’s important based on your rules, not BAS alerts set by manufacturers. Allocate resources to top priorities.

Our KPI-based building portfolio management system operates on this simple principle

Red light, green light. Our signal system makes it simple to see which mechanical systems across your entire portfolio map are performing according to KPI’s (Key Performance Indicators) you’ve set (green dots), and which aren’t (red dots). Query any KPI, standard or criterion you define, for any period of time. See what’s important based on your rules, not BAS alerts set by manufacturers. Allocate resources to top priorities.

We sweep your portfolio, filter what’s important, and show it to you quickly, with easy drill-down into details.

Red Dots

“Red dot” buildings on your portfolio map need your attention. Their mechanical systems aren’t on track with your KPI’s and rules.. Drill down into the details. Fix top priority problems proactively. Manage maintenance from afar. No more wasted truck rolls.

Green Dots

All systems are go! These buildings are performing based on the KPI parameters you’ve set: temperatures, air dampers, compressor runtime, energy consumption, lighting. If they had a problem, it’s been fixed correctly: the green dot is a validation.

Red dots

“Red dot” buildings on your portfolio map need your attention. Their mechanical systems aren’t on track with your KPI’s and rules.. Drill down into the details. Fix top priority problems proactively. Manage maintenance from afar. No more wasted truck rolls.

Green dots

All systems are go! These buildings are performing based on the KPI parameters you’ve set: temperatures, air dampers, compressor runtime, energy consumption, lighting. If they had a problem, it’s been fixed correctly: the green dot is a validation.

REQUEST A DEMO